
Market analysts say Ether (ETH) faces “downside risks” that could trigger another 20% downtrend toward $1,700, new analysis said.
Key takeaways:
- Rising Ether supply on exchanges and declining ETF inflows suggested a possible ETH price drop over the coming days.
- Ether’s rising wedge pattern projected a potential 22% drop to $1,725
ETH inflows to exchanges rise
Ether’s 40% recovery from multi-month lows below $1,800 was dampened by resistance from the $2,400 level.
Analysts have outlined several reasons for Ether’s inability to break $2,400, including “significant” inflows into exchanges, according to CryptoQuant analyst BorisD.

The chart below shows a sharp increase in ETH reserves held on Binance to 3.84 million from 3.36 million between May 5 and May 9.
The analyst explained that as inflows accelerated, the “price action failed to show strong continuation to the upside,” dropping 7% to $2,260 from $2,390 over the same period.
“This suggests that liquidity was being both absorbed and distributed within the range,” BorisD said, adding:
“The broader structure still points toward downside risk remaining dominant for now.”
ETH exchange reserve on Binance. Source: CryptoQuant
While other analysts see potential for fresh upside in the coming days, “those moves may primarily serve distribution purposes rather than signal the start of a strong bullish trend,” the analyst added.
Making the same observations, fellow analyst PelinayPA said any short-term rebound in ETH would be “followed by high volatility, and then a continuation of the broader downtrend,” adding:
“The large amount of ETH being moved onto exchanges continues to create significant resistance against upward price movements.”
This coincided with sharp exchange inflows, as the Ether net position change among exchanges rose to 585,000 ETH on May 13, marking the largest spike since December 2025, when ETH was trading at $3,000. This preceded a 42% drop to $1,750 in February.
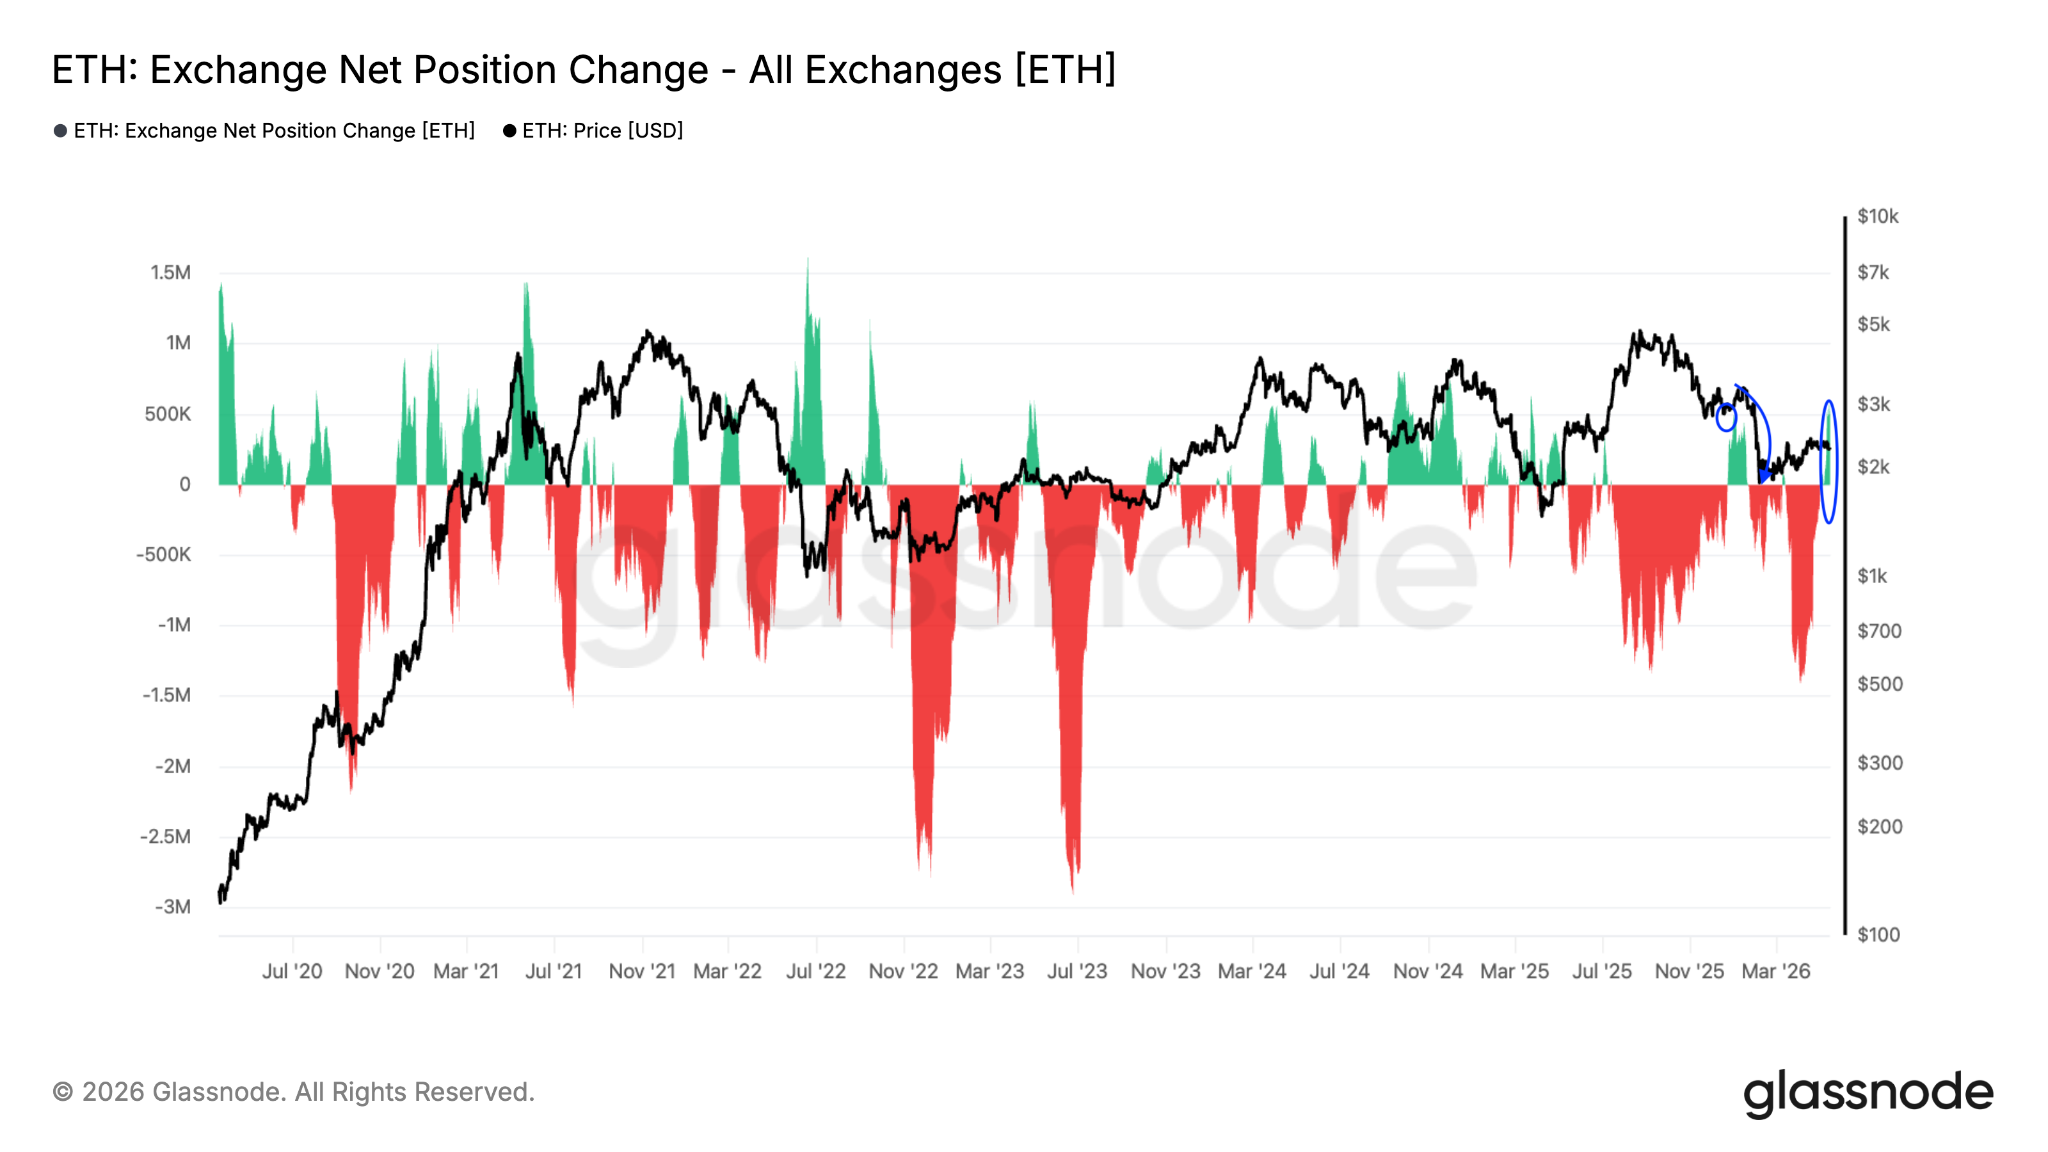
ETH: Exchange net position change
Such inflows typically indicate distribution by large holders, who move tokens from cold storage or redeem ETH investment products.
Meanwhile, demand for spot Ethereum ETFs continues to decline, with these investment products recording outflows for four consecutive days, totalling $190 million. This points to a drop in demand from US investors, adding to Ether’s headwinds.
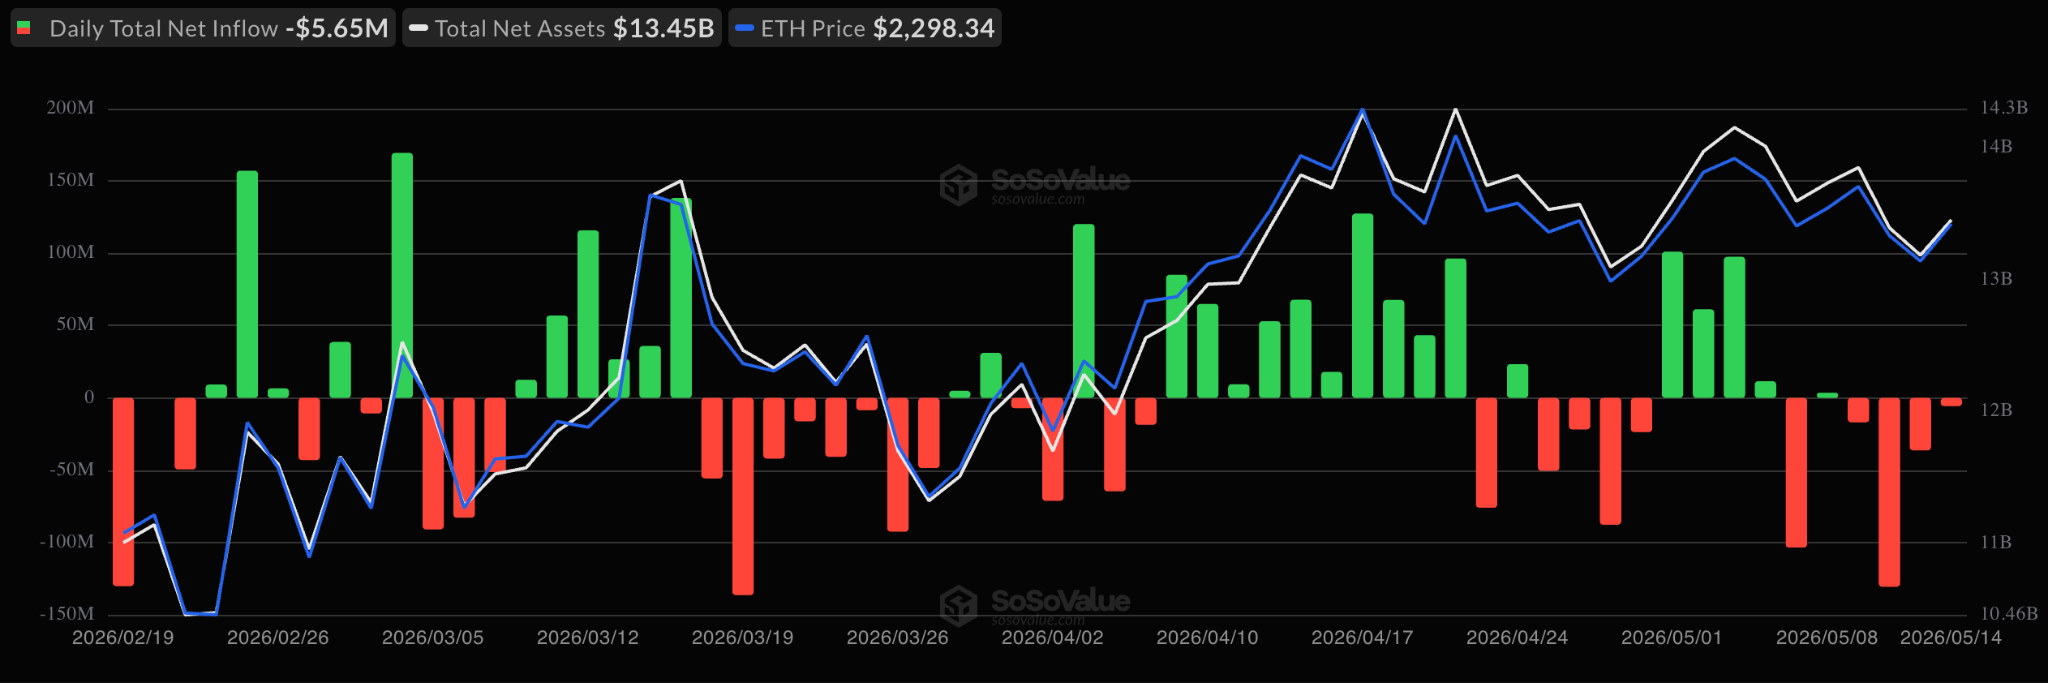
Spot ETH ETFs flows chart. Source: SoSoValue
Ether’s rising wedge targets $1,725
The daily chart shows ETH/USD validating a rising wedge breakdown, after the price breached the support provided by the lower trend line of the pattern at $2,280.
A daily candlestick close below this level will confirm the breakdown, clearing that path for Ether’s drop toward the wedge’s measured target at $1,725, representing 22% decline from the current price. This coincides with its previous macro low reached on Feb. 6.
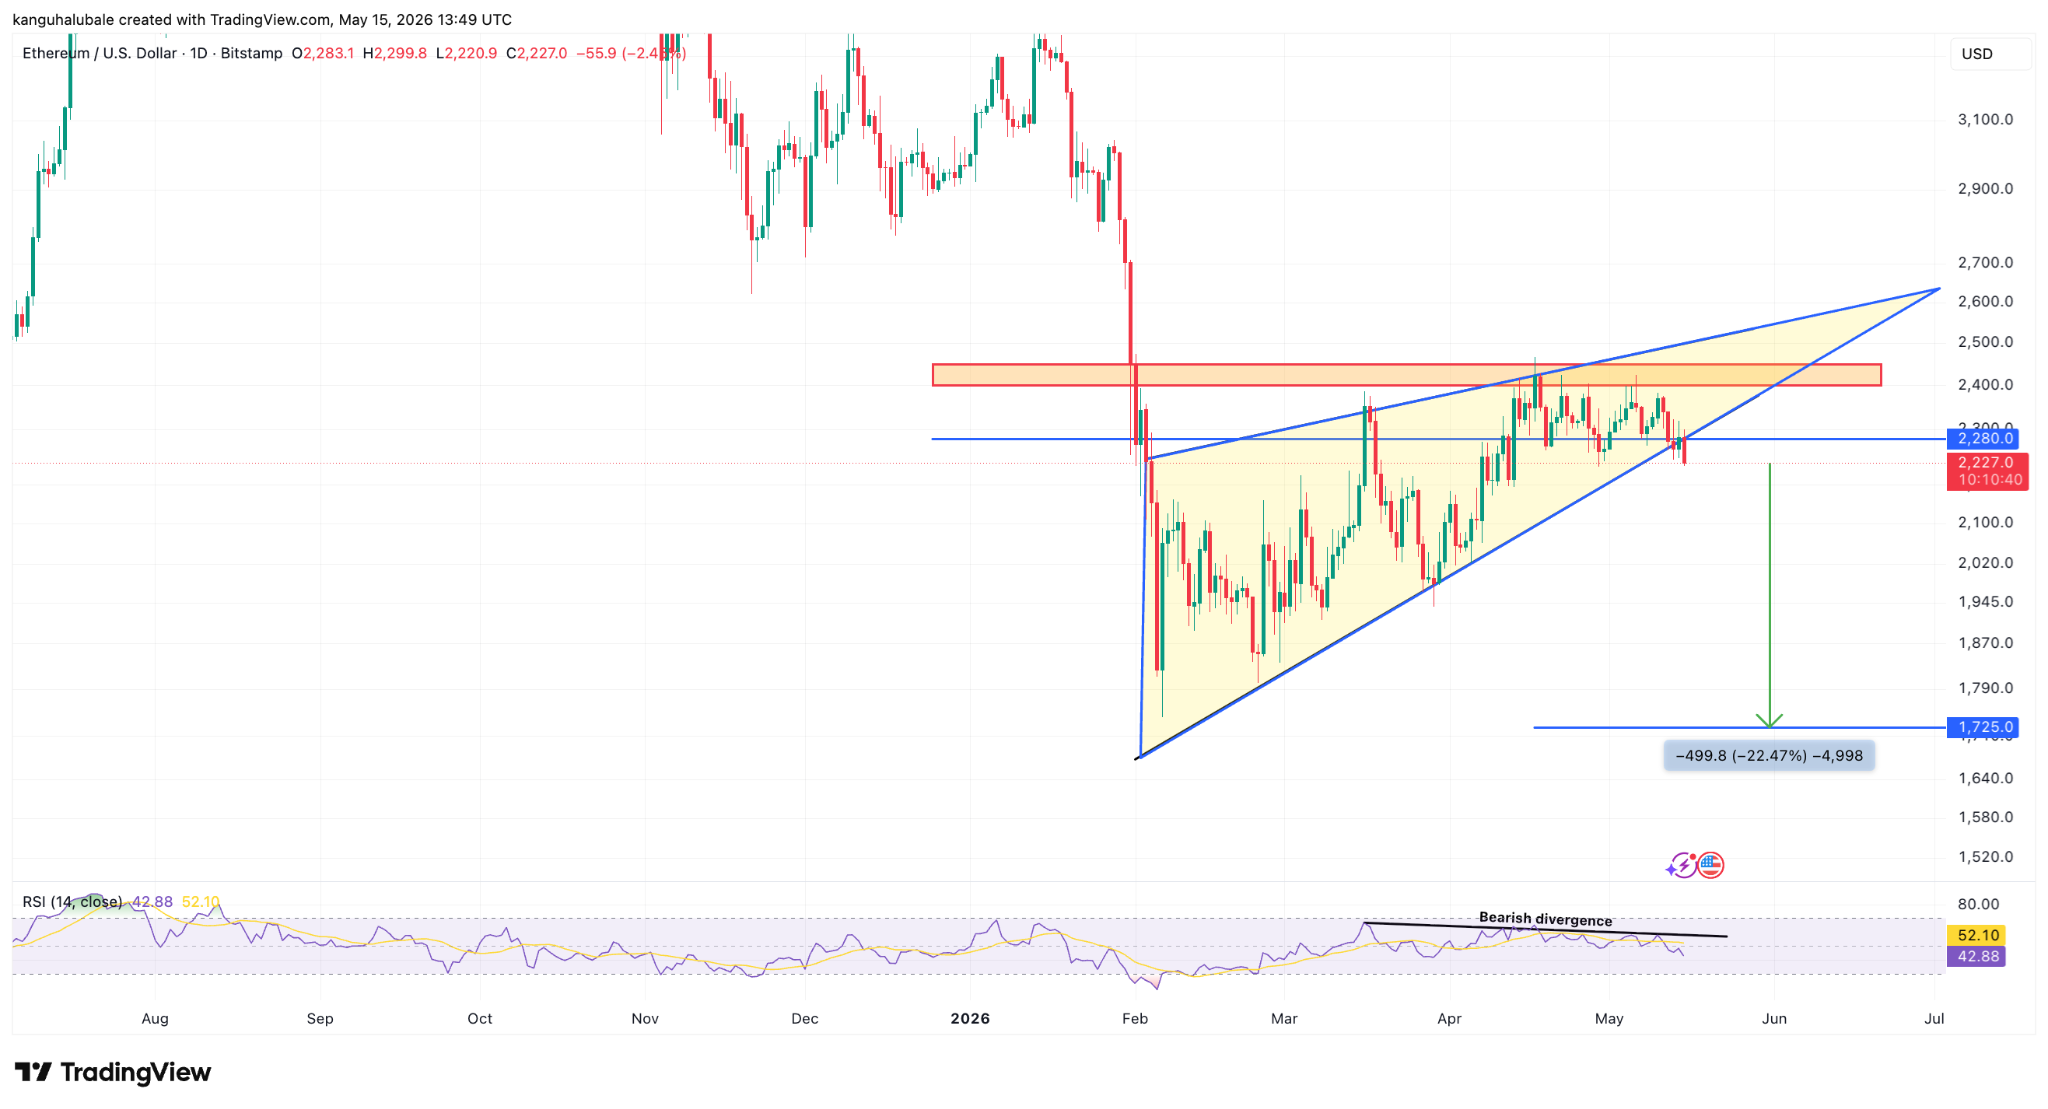
ETH/USD daily chart. Source: Cointelegraph/TradingView
Rising wedges are typically bearish reversal patterns, and Ether’s break below the pattern is “starting to become a concern,” analyst ShangoTrades said in a recent X post.
Zooming out, fellow analyst CryptoBullGod said ETH could drop to $1,280, which is the measured target of a bear flag, as shown on the weekly chart below.
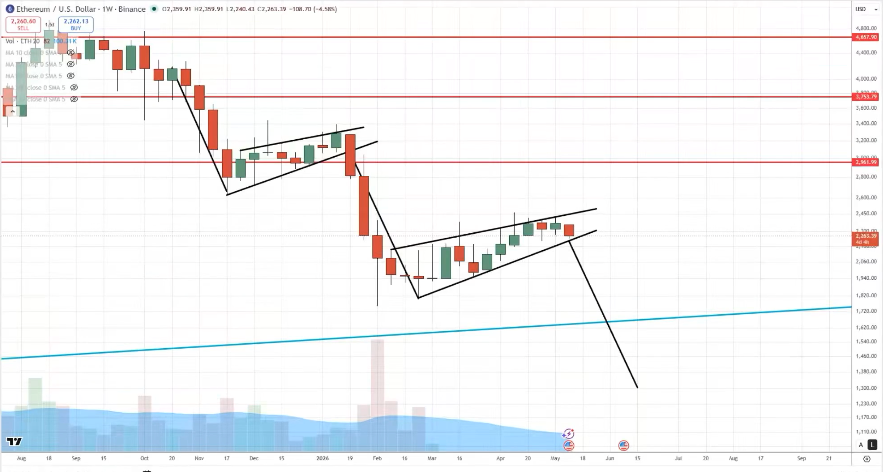
ETH/USD weekly chart. Source: CryptoBullGod